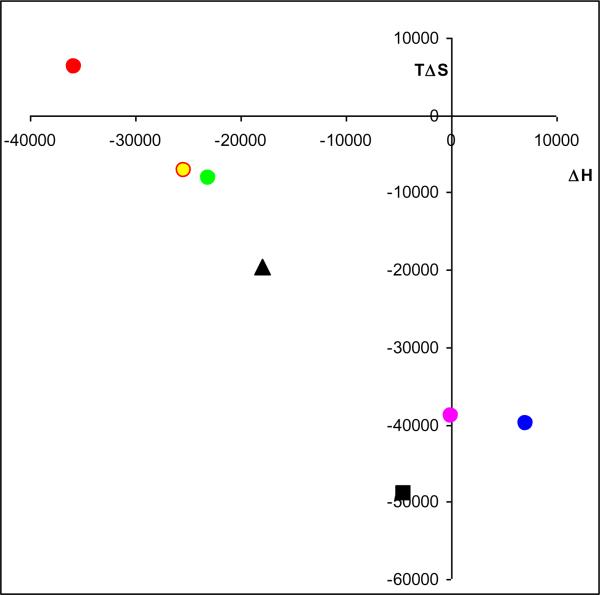
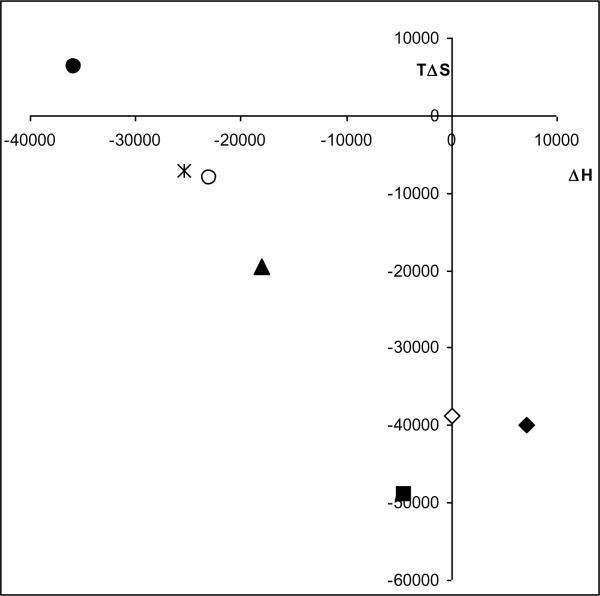
Figure 4.
(Online version) Enthalpy/entropy relation plot for (S,S')-fenoterol ( ), (S,R')-fenoterol (
 ), (R,S')-fenoterol (
 ), (R,R')-fenoterol (
 ), rac-propranolol (∎), (R)-isoproterenol (▴). The plot indicates also the location determined for rac-fenoterol (
 ) by Weiland et.al [1].
(Black and White print version) Enthalpy/entropy relation plot for (S,S')-fenoterol (●), (S,R')-fenoterol (○), (R,S')-fenoterol (◆), (R,R')-fenoterol (◊), rac-propranolol (∎) , (R)-isoproterenol (▴). The plot indicates also the location determined for rac-fenoterol ( ) by Weiland et.al [1].


