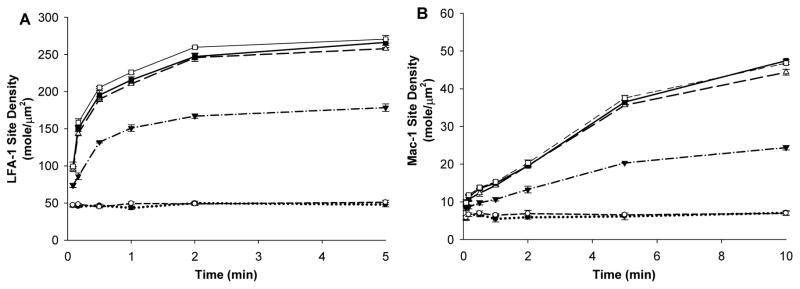
Figure 5. Mac-1 and LFA-1 expression profiles on PMNs after IL-8 stimulation.
PMNs were treated with various concentration of IL-8 for various durations. Following treatment, the LFA-1 and Mac-1 expressions on PMNs were detected using flow cytometry. Site density data were calculated by multiplying the ratio of activated to non-activated fluorescence intensity and the known expression numbers of Mac-1 (5 mole/μm2) and LFA-1 (45 mole/μm2) on non-activated PMNs (Simon and Green, 2005). (A) LFA-1 expression on PMNs after IL-8 stimulation; (B) Mac-1 expression on PMNs after IL-8 stimulation. Values were mean ± SEM for N≥3.○, No stimulation; ●, 0.01 nM; ▼;, 0.1 nM; △, 1 nM; ■, 5 nM; □, 10 nM.

