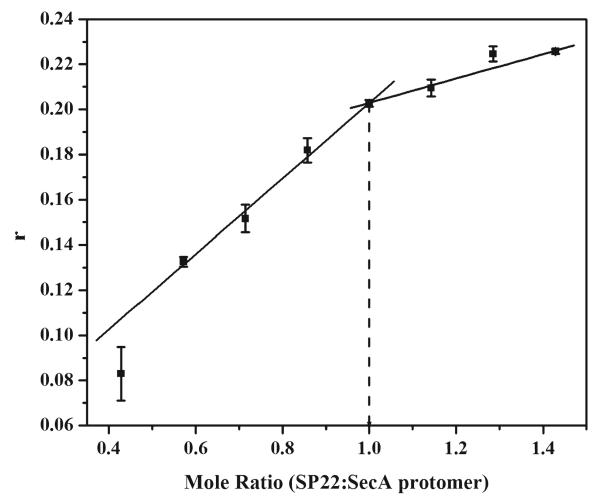
Figure 4. Stoichiometry of SecA–signal peptide binding as determined by fluorescence anisotropy.
Binding of IANBD-labeled SP22 (■) to SecA was assessed as fluorescence anisotropy (r) and plotted to reveal the saturated molar ratio of SP22 to SecA protomer. IANBD-labeled SP22 was titrated from 0 to 20 μM into a solution of 14 μM wild-type SecA. All experiments were performed in TKE buffer at 20 °C.

