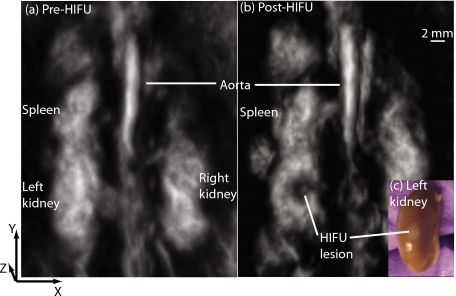
Figure 2.
Reconstructed OA images of the abdominal volume of a mouse using 1064-nm light acquired (a) pre-HIFU exposure and (b) post-HIFU exposure. Grayscale intensity represents the magnitude of the local OA signal, which is related to the local optical absorption. The HIFU transducer’s focus was aligned at the left kidney, and the HIFU axis was parallel to the z axis. The post-HIFU image clearly shows a region in the left kidney with reduced optical contrast (lower blood concentration) corresponding to the HIFU-induced lesion as confirmed upon visual inspection (c).

