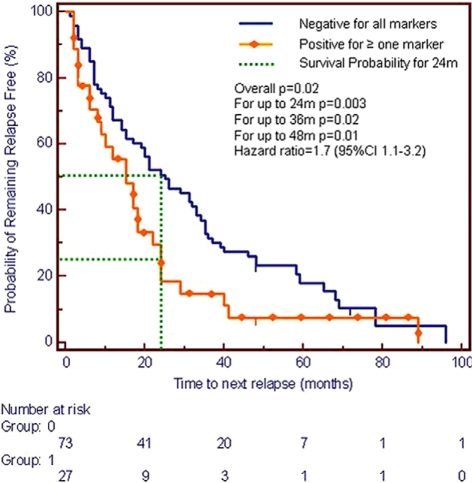
Figure 4.
Time to CDMS, Kaplan–Meier, survival plot for cohort-C. FP patients positive for ≥1 (anti-GAGA4, -GAGA2, -GAGA3, or -GAGA6 IgM) versus patients negative for all markers. Cutoff values were 4.0, 4.5, 4.5, and 4.3 for anti-GAGA2, -GAGA3, -GAGA4, and -GAGA6 IgM, respectively. P-values determined by log rank test. With Bonferroni correction only P-values below 0.0125 are considered significant.

