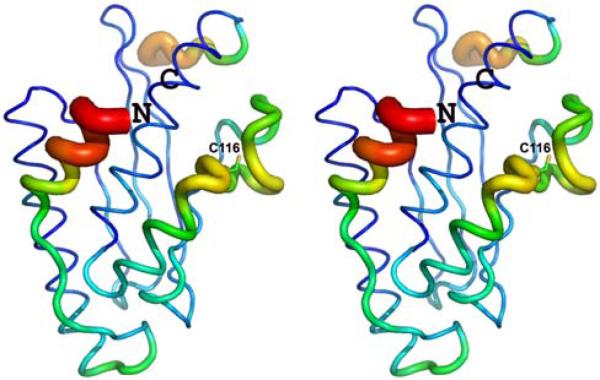
Fig. 7.
Stereo representation of Cα B-factors along the polypeptide chain of Ufc1 in crystal structure 3EVX: the thickness of the cylindrical rod is proportional to the B-factors. The N- and C-terminal ends of the protein are labeled as ‘N’ and ‘C’. Blue polypeptide segments show the lowest B-factors, followed by green, yellow, orange, and red indicating increasing B-factors.

