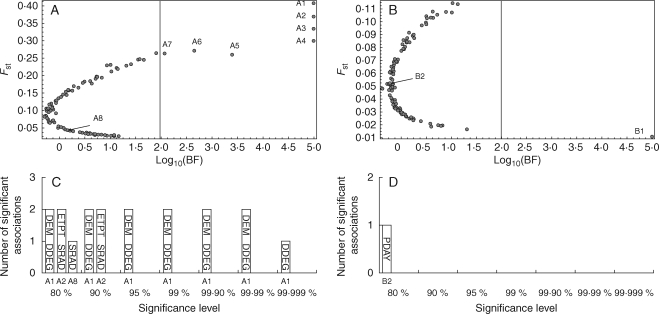
Fig. 2.
Genome scans for loci under selection in a trailing-edge population (A, C) and a leading-edge population (B, D) of Biscutella laevigata. (A) and (B): BayeScan analysis, with the posterior probability for a locus to be under natural selection on the x-axis (log scale). The vertical line indicates the threshold beyond which there is a decisive evidence for selection. (C) and (D) Sam analysis, with significant associations between particular AFLP loci and eco-climatic parameters indicated on bars (DEM, altitude; DDEG, degree-days during growing season; ETPT, daily average evapotranspiration; PDAY, number of precipitation days during growing season; SRAD, daily average radiation). Sections on the x-axis refer to different significance levels. Loci detected by BayeScan and/or Sam are called A1 to A8 and B1 and B2.

