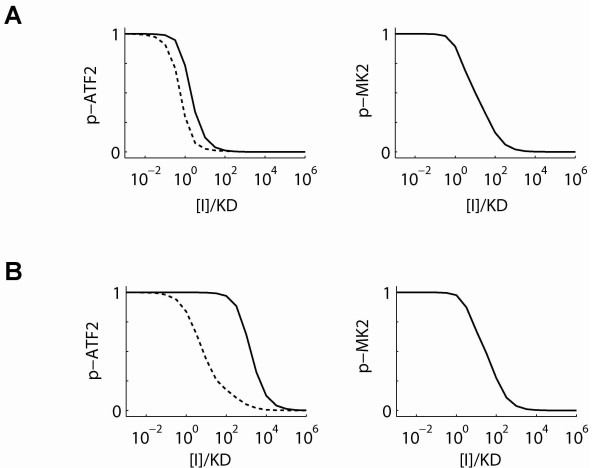
Figure 10.
Inhibitor simulations. The dose-response of phospho-ATF2 and phospho-MK2 are simulated for A, classical p38 inhibitors and B, substrate-selective p38 inhibitors. Solid lines indicate results from single substrate assay and dashed lines indicate results for dual substrate assay. Association rate constants of inhibitors are assumed to be diffusion-limited and inhibitor concentrations are normalized by their affinities (KD).

