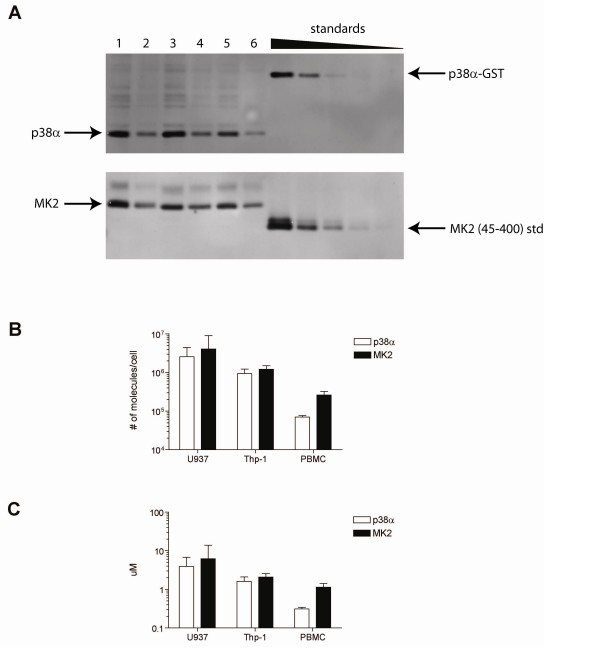
Figure 12.
Protein expression levels. A, sample Western blots used for quantitation of total p38α and MK2 protein levels. On these representative blots, U937 cell lysates from 3 different experiments (lanes [1-4] and [5,6]) are loaded at 5 ug total protein (lanes 1, 3, 5) and 2 ug total protein (lanes 2, 4, 6), as measured by BCA assay. Recombinant p38-alpha and MK2 standards were loaded using 3-fold dilutions starting from 1.68 × 10¹⁰ and 1.34 × 10¹¹ molecules per lanes, respectively. Cell lysates from U937 (n = 11, 13, for p38 and MK2 blots, respectively), Thp-1 (n = 4, 3) and PBMCs (n = 3, 4) were measured. Images were quantified with densitometry and total p38α (open bars) and MK2 (filled bars) protein expression levels were calculated. Results are shown in B, # of molecules/cell and in C, uM. Data is shown ± standard deviation.

