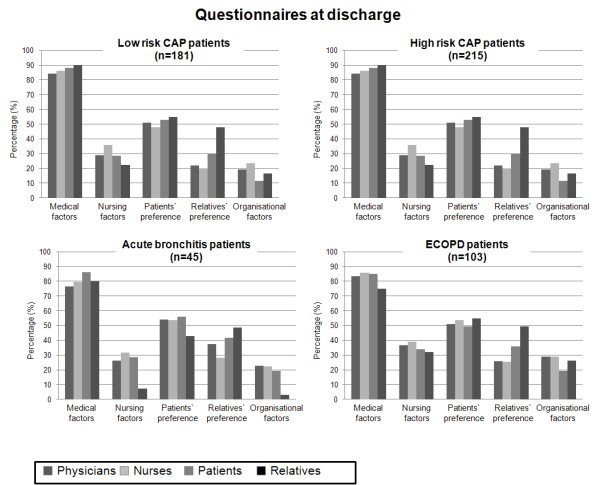
Figure 3.

Reasons for inpatient treatment at discharge on a scale from 0-100% in all subgroups of patients. First column (dark grey) representing physicians, second column (very-light grey) representing nurses, third column (light grey) representing patients, fourth column (black) representing patients' relatives. Of note, the number of patients (n) corresponds to the total number of included patients.
