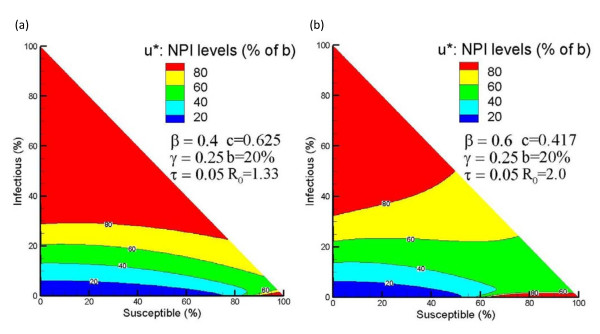
Figure 4.
Optimal NPI policy obtained under quadratic control cost. Figure 4 presents the optimal NPI policy obtained under quadratic control cost. (a) presents the optimal NPI policy assuming quadratic control cost for an influenza pandemic characterized as β = 0.4, γ = 0.25, τ = 0.05, c = 0.05, and b = 0.2β. (b) presents the optimal NPI policy assuming quadratic control cost for an influenza pandemic characterized as β = 0.6, τ = 0.25, γ = 0.05, c = 0.05, and b = 0.2β.

