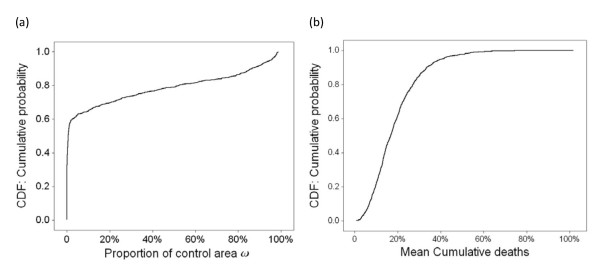
Figure 5.
Empirical CDFs for the proportion of control area and the mean cumulative death obtained from the 1000 LHS scenarios. Figure 5 shows empirical cumulative distribution functions (CDFs) of ω and dT obtained from 1000 LHS scenarios. (a) shows the empirical CDF for the proportion of control area, ω. (b) shows the empirical CDF for the mean cumulative death, dT.

