
Figure 4.
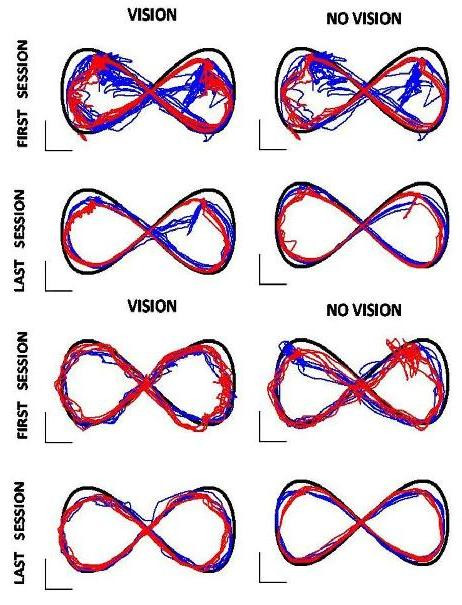
Tracking trajectories. Top panel is related to subject S1 who has a sever impairment level (FMA = 4). Bottom panel is related to subject S3 who is affected in a lighter way (FMA = 25). Blue line denotes the clockwise-right/counterclockwise-left sequence; Red denotes the counterclockwise-right/clockwise-left sequence. The black line represents the correct trajectory.