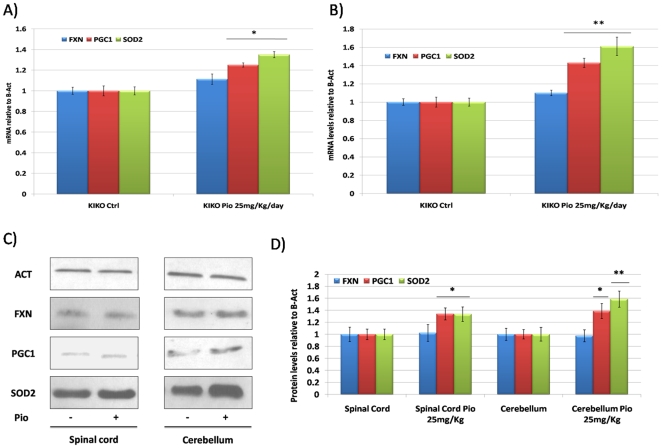
Figure 5. In vivo Pioglitazone administration in KIKO mice.
A. Quantitative Real-Time PCR analysis: fxn (Blue bars), pgc-1α (Red bars) and sod2 (Green bars) mRNA quantification in the spinal cord of the KIKO mice after receiving oral administration of Pioglitazone 25 mg/Kg/day for one month. B. Quantitative Real-Time PCR analysis: fxn (Blue bars), pgc-1α (Red bars) and sod2 (Green bars) mRNA quantification in the cerebellum of the KIKO mice after receiving oral administration of Pioglitazone 25 mg/Kg/day for one month. C. Western Blot analysis: β-actin (Act), pgc-1α (PGC-1), frataxin (FXN), mitochondrial superoxide dismutase (sod2) protein in the spinal cord and cerebellum of the KIKO mice after receiving oral administration of Pioglitazone 25 mg/Kg/day for one month. D. Densitometric scan analysis of five independent Western blots from the spinal cord and cerebellum of the KIKO mice after receiving oral administration of Pioglitazone 25 mg/Kg/day for one month: FXN (Blue bars), PGC-1α (Red bars) and SOD2 (Green bars). The relative intensities of the bands were quantified using the Image J Software, and all the values were normalized to the intensities of the respective β-Actin signal. (n = 10, **p<0.01,*p<0.05; Mean +/− SEM) for all the experiments.

