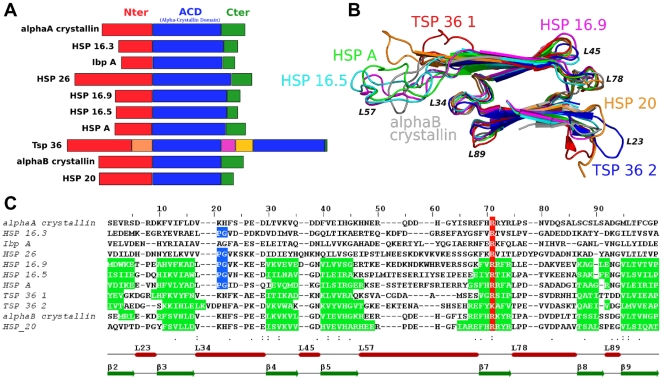
Figure 2. Reference sHSP sequences, superposition of ACD structures and initial multiple structure/sequence alignment.
(A) Scheme of the 10 sequences used for the construction of the profile with delineation of the three regions: the N-terminal region in red, ACD in blue and the C-terminal region in green. For the TSP 36 sequence that contains two ACDs, linkers [18] are shown in orange, pink and yellow (B) Structural alignment of known ACDs with in-between-strand loop annotation, 3D representation made using PyMOL [59] (C) Multiple structure/sequence alignment from 3DCoffee on the ACD region. The secondary structure assignment is shown in green,  strands are annotated as green arrows and loops as red bars. ACD is subdivided into three parts: the
  2–
2– 5 zone, the L57 loop and
  7–
7– 9 zone. The conserved arginine [15], [40] is shown in red and the P-G doublet [15], [36] in blue. Alignment representation performed using Jalview [60].

