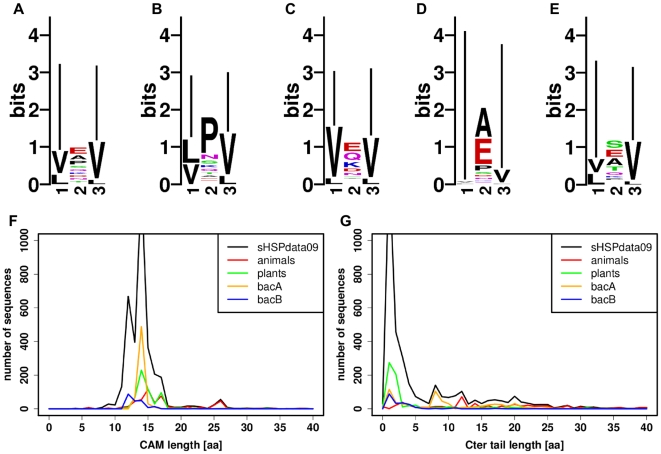
Figure 5. Logo representation of the I/V/L-X-I/V/L motif and length distributions of CAM and Cter tail.
Logos are displayed for (A) sHSPdata09, (B) animals, (C) plants, (D) bacA and (E) bacB. The length distributions of CAM (F) and Cter tail (G) are computed for sHSPdata09 (in black), animals (in red), plants (in green), bacA (in orange) and bacB (in blue). The tops of the sHSPdata09 length distributions are truncated for reasons of clarity. Sequence lengths correspond to a number of amino acids (aa).

