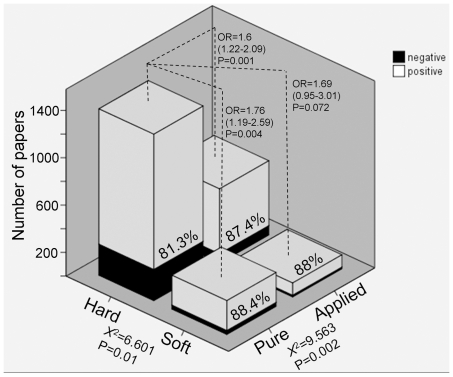
Figure 2. Positive Results by Disciplinary Dimension.
Number of papers that supported (white) or failed to support (black) a tested hypothesis, classified by disciplinary categories based on dimensions identified by previous studies (see text for explanations). Percentage in each bar refers to positive results. OR = Odds Ratio (and 95%Confidence Interval) of reporting a positive result compared to the reference category of Hard/Pure disciplines. Chi square was calculated for each dimension separately (for category composition see Fig. 1).

