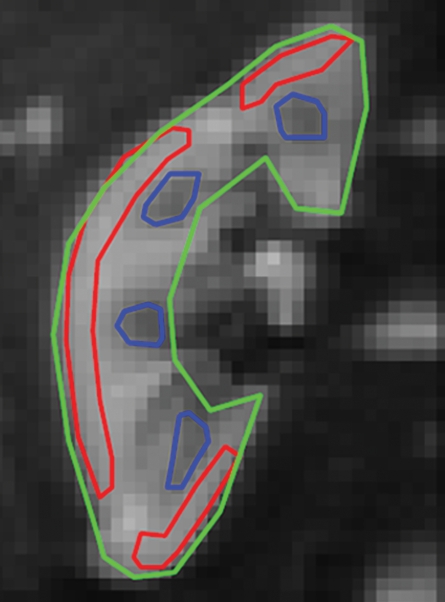
Figure 2a:
Examples of ROI selection and biexponential fitting. Green = whole parenchyma, red = cortex, and blue = medulla. (a) ROIs selected in one section (averaged over nine repeats) of b = 0 sec/mm2 image. (b) The diffusion decay signals (S) in the volunteer in a, who was measured with 16 b values from 0 to 750 sec/mm2, and the biexponential fits are shown. Error bars = total intra-ROI heterogeneity due to physiology and radiofrequency shading, among others. (c) ROIs in one section in another volunteer who had a right upper pole cyst (magenta). The generated signals (S) and fits are shown in d. For this volunteer, the whole-kidney ROI was drawn in the other kidney without cyst, and the whole-kidney signal is not shown in d. All curves were well fitted using the biexponential equation (Eq [1]).

