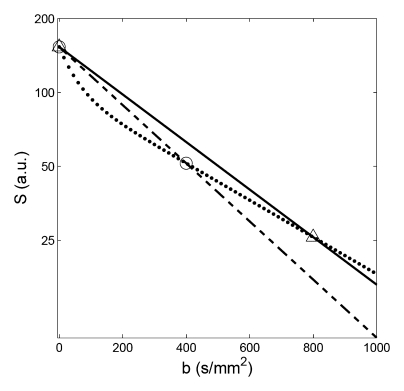
Figure 3:
Examples of resampling and then monoexponential fitting in simulation. Resamplings were performed from the whole-parenchyma diffusion decay curve (dotted line) at b values of 0 and 400 sec/mm2 (circles, dashed line: monoexponential fit, resulting ADC = 2.7 × 10⁻³ mm2/sec), and at 0 and 800 sec/mm2 (triangles, solid line: monoexponential fit, resulting ADC = 2.2 × 10⁻³ mm2/sec).

