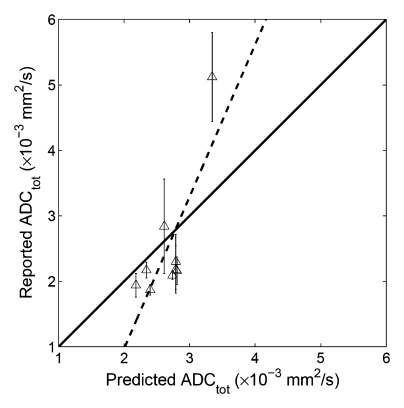
Figure 5c:
Correlation plots between predicted ADC (ADCtot) and reported values. (a) Whole parenchyma: y = 0.44x + 1.21, R2 = 0.50, P = .002; (b) renal cortex: y = 1.73x−2.30, R2 = 0.87, P = .0002; (c) renal medulla: y = 2.32x−3.68, R2 = 0.61, P = .0129. Solid line = line of identity, dashed line = line of regression. The majority of the variability in published values of ADC can be attributed to the application of a monoexponential fit to limited b value data.

