
Fig. 5.
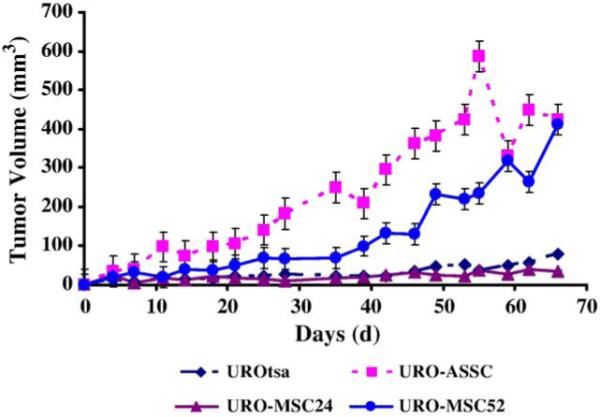
Tumorigenicity of URO-MSC cells in SCID mice. Tumor volumes were measured two times per week. Data are tumor volume (mm3) per time (days). Bars represent mean ± SEM (n = 4). However, error bars in UROtsa and URO-MSC24 tumors are too small to visualize. Significant changes in tumor volume were identified with ANOVA followed by Bonferroni’s multiple comparisons test. P < 0.05 was considered significant. URO-ASC tumors are statistically different in tumor volume from UROtsa 30 days after injection. URO-MSC52 tumors are significantly different from UROtsa 40 days after injection.