Abstract
It is estimated that a quarter of a million people in the USA are living with kidney cancer. In clinical practice, the response to treatment is monitored by manual measurements of tumor size, which are time consuming and show high intra- and inter-operator variability. We propose a computer-assisted radiology tool to assess renal tumors in contrast-enhanced CT for the management of tumor diagnoses and treatments. The algorithm employs anisotropic diffusion, a combination of fast-marching and geodesic level-sets, and a novel statistical refinement step to adapt to the shape of the lesions. It also quantifies the 3D size, volume and enhancement of the lesion and allows serial management of tumors. The comparison between manual and semi-automated quantifications shows disparity within the limits of inter-observer variability. The automated tumor classification shows great separation between cysts, von Hippel-Lindau syndrome (VHL) lesions and hereditary papillary renal carcinomas (HPRC) (p < 0.004).
INDEX TERMS: contrast-enhanced CT, kidney cancer, quantification, classification, computer-assisted radiology
1. INTRODUCTION
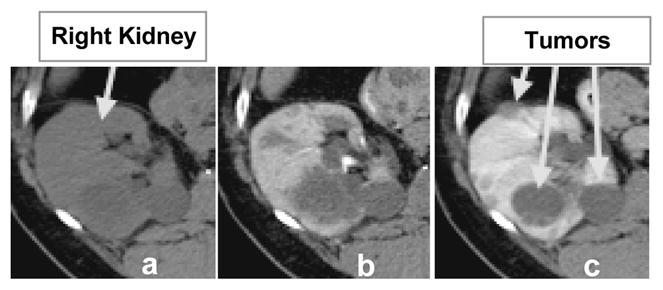
It is estimated that almost a quarter of a million people in the USA are living with kidney cancer and their number increases by 51000 yearly [7]. Contrast-enhanced CT has proven exceptionally useful to an improved diagnosis due to the ability to differentiate tumors from healthy kidney tissue [1,15]. Figure 1 shows an example of normal kidney parenchyma and lesion intensity change in contrast-enhanced CT. The level of enhancement in the tumor is an important indication of malignancy; equally important is the growth or regression rate of tumors for a better targeted therapy.
Figure 1.

Multi-phase abdominal 4D CT data. 2D slices of 3D volumes: (a) before contrast, (b) arterial enhancement phase and (c) venous/portal enhancement phase data.
As manual measurements are time consuming and show high intra- and inter-operator variability, computer-assisted radiology (CAR) shows great promise in assisting the robust monitoring of renal tumors. Moreover, the two-dimensional (2D) bias toward the image acquisition plane manifested during the manual quantification of cancer can be removed by the 3D analysis allowed by computer analysis.
Most work in renal image analysis relates to kidney segmentation and not to kidney cancer quantification [2,5,9,12]. The segmentation of renal tumors is seldom addressed. Notably, a marker-controlled watershed algorithm is used in [13] to segment both renal and lesion volumes in 2D data using three manual contours and granulometry. Alternatively, a homogeneous region growing from a seed point is presented in [6].
Our study proposes the semi-automated quantification of renal tumors for the assertive management of tumor diagnoses and monitoring. It quantifies the three-dimensional size, volume and enhancement of renal tumors. The algorithm employs registration and smoothing to prepare the data, a combination of fast-marching and geodesic level-sets for segmentation, and lesions quantification. As a major challenge to robust CAR remains the reliable visualization and identification of tumor boundaries, a novel refinement step to adapt to the shape and intensity of the lesions is proposed. This is, to our knowledge, the first semi-automated method that quantifies and classifies the enhancement of renal tumors and allows the serial analysis of renal tumors.
2. METHODS
Our contrast-enhanced CT data consisted of three serial acquisitions. The first image was obtained before contrast administration. Then the patients were injected with 130ml of Isovue-300 and two contrast-enhanced data acquisitions were completed during arterial and portal phases. The distinction between phases was performed using fixed delays of 25–30s and 65–70s for the arterial and venous phases respectively, depending on the scanner. Data were collected using LightSpeed Ultra and QX/i (GE Healthcare) and MX 8000 scanners (Philips Healthcare). Image resolution ranged from 0.7 × 0.7 × 1 mm3 to 0.97 × 0.97 × 1 mm3.
Data from 10 patients with renal tumors were analyzed: 5 diagnosed von Hippel-Lindau (VHL) syndrome cases and 5 hereditary papillary renal carcinomas (HPRC). A total of 31 lesions were analyzed from the patient scans: 14 HPRC, 8 VHL and 9 benign cysts. Patients had between one and two scans, bringing the number of analyzed lesions to 55.
Lesions are segmented in the venous phase, when they appear better differentiated from the enhanced renal tissue. Cysts remain radiolucent during enhancement with well defined edges and homogenous appearance. VHL lesions tend to be solid and enhance more. HPRC tumors vary from cystic to solid and can be a mixture of the two types.
The method for lesion analysis can be subdivided into three major steps: pre-processing, segmentation and quantification. The implementation uses Visual C++ 8.0 (Microsoft), OpenGL (SGI) and the Insight Segmentation and Registration Toolkit (ITK) 3.4.
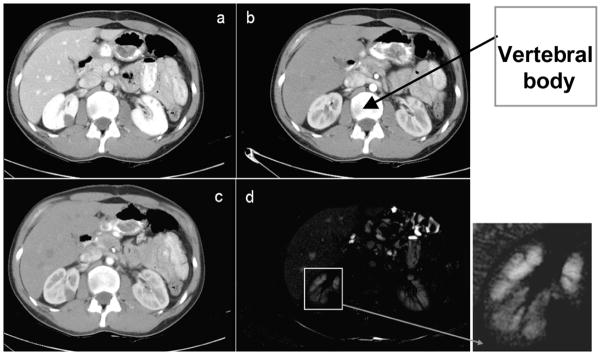
Data from the three-phase scans are first automatically aligned by the image position relative to the body. The preprocessing of images includes an intra-patient inter-phase registration and data smoothing. The Perona-Malik anisotropic diffusion [10] was employed for smoothing and the demons non-linear algorithm for registration [14]. The images from the first two phases of contrast-enhanced abdominal CT data are registered to the venous phase. The relatively limited range of intra-patient motion between phases permits the use of the demons non-linear registration algorithm, which requires partial overlaps between the objects to be registered, in this case between each organ over multiple phases [15]. The contrast-enhanced CT data are intra-modal, but the organ enhancement justifies the use of a multimodal similarity measure, in our case mutual information [8]. Registration results are interpolated with cubic B-splines, as seen in Figure 2.
Figure 2.
Intra-patient 3D registration. This example shows results of registering data from arterial and portal phase: (a) a 2D slice from portal phase; (b) the corresponding 2D slice at arterial phase, aligned by the position in the body, as seen at the vertebral body; (c) the registered image from (b); (d) the difference between (a) and (c) after non-linear registration.
The second stage of the method is the segmentation of renal lesions using a combination of fast marching and geodesic active contour level sets [3,11]. A fast marching level set initializes the segmentation expanding from a seed point provided by the user. The venous phase CT scan (I3) provides the feature image and the sigmoid of the gradient of I3 supplies the edge image Ie. Then, a better-adapted level set based on geodesic active contours refines the fast marching segmentation [3].
| (1) |
The adaptation of algorithm to image characteristics is important for the robustness of the segmentation and the independence of the method on parameter setting and user intervention. Notably, the speed function Ie plays an essential role in the evolution of the isosurfaces. As seen in equation (1), Ie is dependent on parameters α and β. α relates to the minimum gradient on the lesion boundaries, while β tothe mean gradient values within the tumor.
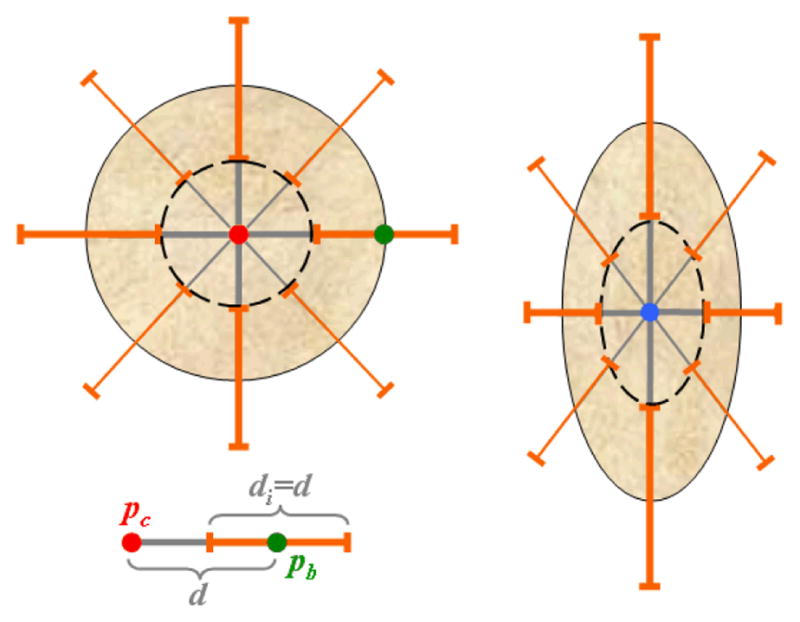
As lesions can be heterogeneous, the segmentation algorithms could stop at inner-lesion edges. Hence, the initialization of the segmentation is performed manually to provide both information about the location and range of size of the lesion to quantify, and knowledge about the strength of the tumor boundaries in relation to its inner edges. To keep the user intervention minimal, only two points are required on an axial slice: one for the approximate tumor center pc, and a second along one of its boundaries pb. The first approximation of a lesion is that of a sphere. Given the center and boundary of a lesion, the gradient values along 26 rays originating from pc are recorded. As shown in a simplified 2D representation in Figure 3, we retain the gradient values on segments d centered on the sphere boundary to compute α. The dashed circle in the left part of Figure 3 represents the area that is used to compute β. As many tumors are not spherical, we further correct for the erroneous placement of pc and pb.
Figure 3.

Parameter adaptation. The initial lesion model is spherical with radius d, as seen in the simplified 2D representation on the left. The elements di used for the estimation of tumor edges and parameter α are shown in orange, the inner object used to compute β in dashed black, and the user landmarks pc and pb in red and green respectively. The parameter calculation is repeated for the updated ellipsoidal model shown on the right.
The analysis of the histogram of gradients along d permits elimination of edge outliers. Both the location of each new edge (with the maximum gradient along each ray) and the value of α can now be estimated. We also assume that the first approximation of α must be at least 20% higher than the initial estimate of β.
| (2) |
The centroid of the object within the new set of boundaries updates the location of pc, and the spherical form is changed to an ellipsoidal model r=(rx,ry,rz), with rx≠ry≠rz, as shown in the right side of Figure 3. The gradients along the edges and inside the ellipsoid are then calculated and the resulting location of the tumor center pc is updated and used as a seed point for the fast marching level set. The updated values of α and β provide an adapted speed function, as in equation (1), to assist with the segmentation of lesions.
Finally, we compute the linear and volumetric measurements of a lesion from its segmentation (manual or automatic). We first apply a principal component analysis (PCA) [4] to compute the principal axes, then project the lesion surface to the principal axes and compute the linear measurement. The volumetric measurement is simply the summation of all voxels inside the segmented region. For the accurate estimate of segmentation overlap between the automatic and the manual segmentations, we compute the dice coefficient D as one metric for validation. SA is the segmented region of the automatic method, and SM is the manually segmented region by an expert. SA∩SM represent the common voxels in SA and SM.
| (3) |
Statistical analyses of the patterns of enhancement were performed for groups of lesions (VHL-HPRC, VHL-cysts and HPRC-cysts). For all lesions we calculated the relative enhancement (difference of mean intensities) between phases (arterial and before contrast, venous and arterial, and venous and before contrast) and we computed the p-values of the two-sample t-test.
3. RESULTS
The semi-automated renal tumor segmentation method was evaluated on a combination of benign cysts and cancers, namely von Hippel-Lindau (VHL) syndrome cases and hereditary papillary renal carcinomas (HPRC). The most difficult segmentation occurs for mixed heterogeneous lesions that are both solid and cystic. A segmentation example is presented in Figure 4.
Figure 4.
An example of 3D segmentation of a VHL cancer. (a) shows a 2D slice from the 3D CT, (b) the segmentation result overlaid on the CT scan, and (c) the 3D rendering of the segmentation at the location of the tumor.
Twelve lesions (5 HPRC, 5VHL and 2 benign cysts) were segmented manually by two observers for the validation of segmentation. The maximum size of lesions varied from 11mm to 72mm. The inter-observer measurements showed an overlap of 0.8±0.06 (p=0.015), while the overlap between the computer segmentation and each of the observers was 0.8±0.06 (p=0.31) and 0.8±0.05 (p=0.77) respectively. The R2 values of the best linear fits for correlated measurements of lesions are 0.967 (inter-observer), and 0.971 and 0.967 (for CAR and observers).
Based on clinical observations of renal tumors on CT [15], we analyzed the patterns of tumor enhancement to differentiate between different types of lesions. We selected 15 lesions, 5 of each type: VHL, HPRC and benign cysts. On registered data, the computer segmentations of lesions from the venous phase were used to estimate the mean intensity of lesions in the other phases. The speed and level of enhancement between lesion groups were compared after normalization by the mean intensity before contrast intake. Figure 5 shows an example of multi-phase segmentation of lesions. Although there is insufficient intensity information for the direct segmentation of tumors from the non-contrast and arterial phases, after non-linear registration and segmentation propagation, our method allows the accurate quantification of lesions at different stages of enhancement.
Figure 5.
Multi-phase segmentation of renal lesions. We present a segmentation example for a VHL cancer on 2D slices of 3D CT data from three phases of enhancement
The best differentiation between tumors is achieved using the relative enhancement between the venous phase and the acquisition before contrast administration. We obtained p-values of 0.004 (VHL to HPRC), 0.002 (HPRC to cysts) and 0.001 (VHL to cysts) with mean relative enhancements of 10±5.5 (cysts), 27.9±8.2 (HPRC) and 88.1±30.2 HU (VHL).
4. DISCUSSION
A method for the semi-automated segmentation and quantification of renal tumors was presented, to assist in the clinical management of tumor diagnoses and monitoring. We quantify the 3D size and volume of renal tumors. Additionally, our method analyzes the enhancement of segmented lesions. The algorithm employs registration and smoothing of data, and a combination of fast-marching and geodesic level-sets for segmentation. We developed a novel parameter estimation scheme to adapt the algorithm to the variability of lesion shapes and heterogeneous intensities.
Three types of renal lesions were analyzed: benign cysts, von Hippel-Lindau (VHL) syndrome cancers and hereditary papillary renal carcinomas (HPRC). The computer-assisted segmentation of tumors was compared with the manual segmentations from two observers and the average segmentation overlap was 80.55%. The disparity is within the limits of inter-observer variability and not significant. The difference in tumor size estimations between our method and the clinical measurements was not significant.
The analysis of lesion enhancement for tumor classification shows great separation between benign cysts, VHL cancers and HPRC cancers (p < 0.004). These results represent the first automated analysis for renal tumor classification and show great promise toward computer-assisted kidney diagnosis. The method further allows the serial analysis of tumors (evolution of size and solidity), which was not addressed in this paper due to the limited space. The temporal evaluation of tumors from serial scans illustrate the potential of the method to become an important tool for disease monitoring, drug trials and noninvasive clinical surveillance.
Future work will involve data from patients undergoing cancer therapy to monitor the response to medical trials. The method will study cystic, solid and mixed tumors and has the potential to be applied to other types of abdominal abnormalities (i.e. liver, spleen and pancreatic tumors).
Acknowledgments
This work was supported by the Intramural Research Program at National Institutes of Health, Clinical Center and National Cancer Institute, Center for Cancer Research.
References
- 1.Birnbaum BA, et al. Renal cyst pseudoenhancement: influence of multidetector CT reconstruction algorithm and scanner type in phantom model. Radiology. 2007;244(3):767–775. doi: 10.1148/radiol.2443061537. [DOI] [PubMed] [Google Scholar]
- 2.Boykov YY, Jolly MP. Interactive graph cuts for optimal boundary & region segmentation of objects in N-D images. Proceedings of International Conference on Computer Vision 2001; pp. 105–112. [Google Scholar]
- 3.Caselles V, Kimmel R, Sapiro G. Geodesic active contours. International Journal on Computer Vision. 1997;22(1):61–97. [Google Scholar]
- 4.Jackson JE. A User’s Guide to Principal Components. New York: John Wiley & Sons; 1991. [Google Scholar]
- 5.Joshi S, et al. Multiscale deformable model segmentation and statistical shape analysis using medical descriptions. IEEE Transactions on Medical Imaging. 2002;21(5):538–550. doi: 10.1109/TMI.2002.1009389. [DOI] [PubMed] [Google Scholar]
- 6.Kim DY, Park JW. Computer-aided detection of kidney tumor on abdominal computer tomography scans. Acta Radiologica. 2004;45:791–795. doi: 10.1080/02841850410001312. [DOI] [PubMed] [Google Scholar]
- 7.Linehan WM. Targeting VEGF receptors in kidney cancer. The Lancet Oncology. 2007;8(11):956–957. doi: 10.1016/S1470-2045(07)70322-4. [DOI] [PubMed] [Google Scholar]
- 8.Mattes D, et al. Eubank W. PET-CT image registration in the chest using free-form deformations. IEEE Transactions on Medical Imaging. 2003;22(1):120–128. doi: 10.1109/TMI.2003.809072. [DOI] [PubMed] [Google Scholar]
- 9.Park H, Bland PH, Meyer CR. Construction of an abdominal probabilistic atlas and its application in segmentation. IEEE Transactions on Medical Imaging. 2003;22(4):483–492. doi: 10.1109/TMI.2003.809139. [DOI] [PubMed] [Google Scholar]
- 10.Perona P, Malik J. Scale-space and edge detection using anisotropic diffusion. IEEE Trans on Pattern Analysis and Machine Intelligence. 1990;12:629–639. [Google Scholar]
- 11.Sethian JA. Level set methods and fast marching methods: evolving interfaces in computational geometry, fluid mechanics, computer vision and materials science. Cambridge University Press; 1999. [Google Scholar]
- 12.Song T, et al. Integrated four dimensional registration and segmentation of dynamic renal MR images. Proceedings of Medical Image Computing and Computer Assisted Intervention; LNCS. 2006. pp. 758–65. [DOI] [PubMed] [Google Scholar]
- 13.Summers RM, et al. Helical CT of Von Hippel-Lindau: semiautomated segmentation of renal lesions. Proc. of International Conference in Image Processing; 2001. pp. 293–296. [Google Scholar]
- 14.Thirion JP. Image matching as a diffusion process: an analogy with Maxwell’s demons. Medical Image Analysis. 1998;2(3):243–260. doi: 10.1016/s1361-8415(98)80022-4. [DOI] [PubMed] [Google Scholar]
- 15.Zhang J, et al. Solid renal cortical tumors: differentiation with CT. Radiology. 2007;244(2):494–504. doi: 10.1148/radiol.2442060927. [DOI] [PubMed] [Google Scholar]


