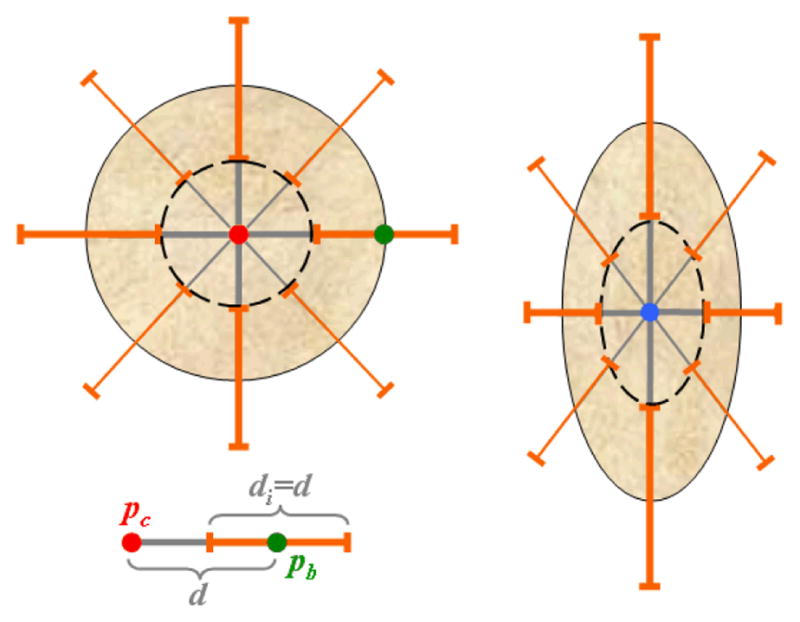
Figure 3.

Parameter adaptation. The initial lesion model is spherical with radius d, as seen in the simplified 2D representation on the left. The elements di used for the estimation of tumor edges and parameter α are shown in orange, the inner object used to compute β in dashed black, and the user landmarks pc and pb in red and green respectively. The parameter calculation is repeated for the updated ellipsoidal model shown on the right.
