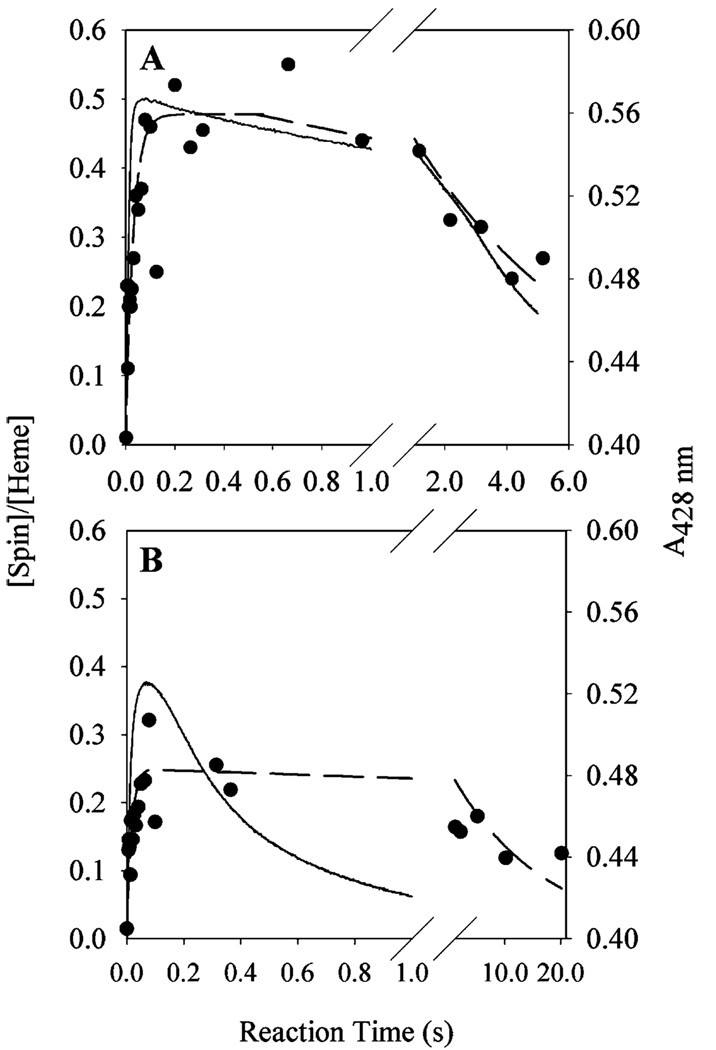
FIGURE 3.
Kinetics of tyrosyl radical and oxyferryl heme levels during reaction of Fe-PGHS-1 with 15-HPETE. Fe-PGHS-1 (15 µM) in 100 mM KPi (pH 7.2), 0.04% octyl glucoside, and 10% glycerol was reacted at room temperature with either 5 (A) or 2 equiv (B) of 15-HPETE. Tyrosyl radical levels were determined by double integration of EPR signals such as those shown in Figure 2 (●), and oxyferryl heme levels were followed by A428 in parallel stopped-flow experiments (─). Dashed lines indicate exponential fits for tyrosyl radical formation and decay phases.

