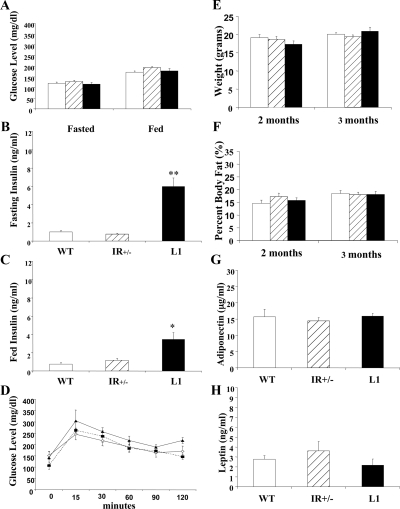
Figure 1.
Metabolic analyses. The data represent the mean ± sem fasted and fed glucose (A) (n = 10–30) and insulin levels (B and C) (n = 6–10) in WT (open bar), IR+/− (striped bar), and L1 (closed bar) females. *, P < 0.01; **, P < 0.001. D, Intraperitoneal glucose tolerance test. The mean glucose level ± sem at each time point after glucose injection is presented. Open diamond, WT; closed square, IR+/−; closed triangle, L1. E and F, The mean ± sem weight and percent body fat in 2- and 3-month-old WT, IR+/−, and L1 females (n = 6–20). G and H, Adiponectin and leptin expression levels were assessed with nonfasting samples (n = 7–15).

