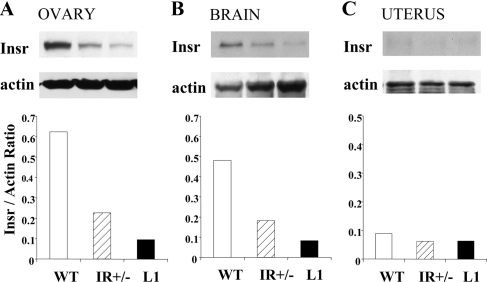
Figure 2.
Levels of insulin receptor expression in the ovary (A), brain (B), and uterus (C). Single brain and uterus samples were used to generate protein lysates; pooled samples from five animals were used for the ovarian lysate. Immunoblot panels represent expression levels of either insulin receptor (Insr) or the loading control protein (actin). The histograms present the ratio of Insr to actin expression.

