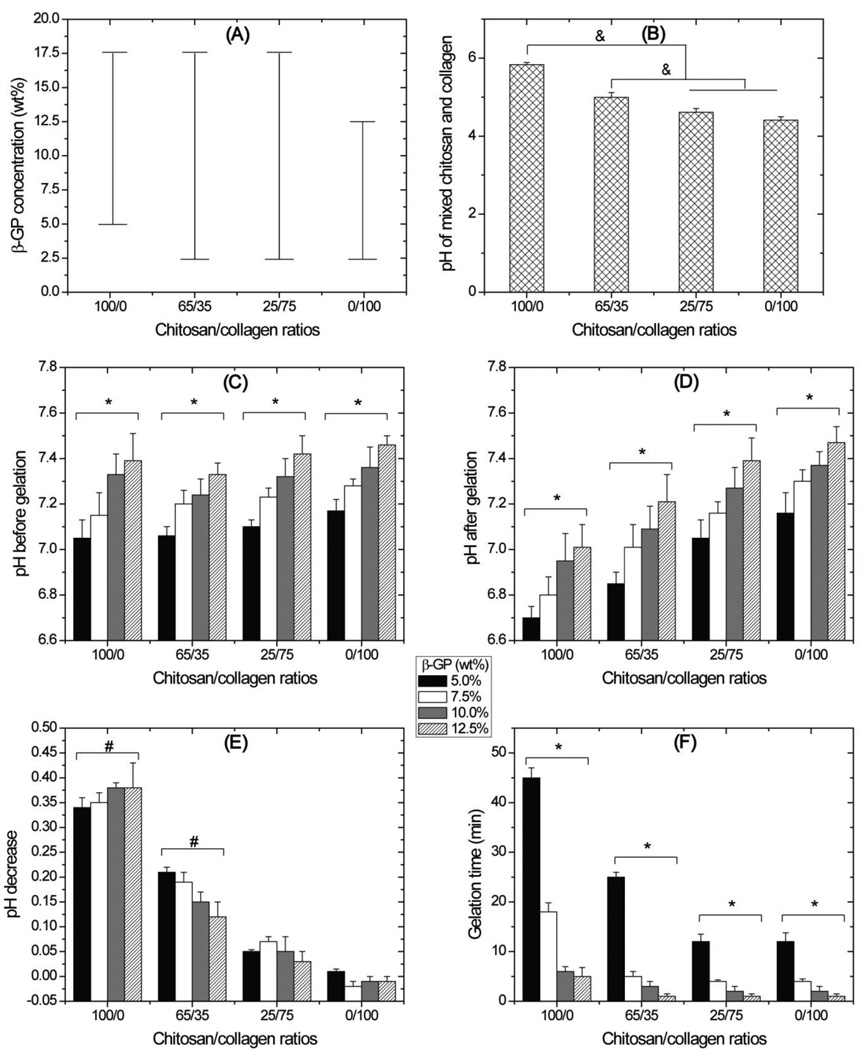
Figure 1.
Gel formation parameters. A: Bars show range of β-GP concentration at which firm hydrogels were formed. B: pH of the chitosan and collagen solutions before β-GP addition. C: pH of the chitosan and collagen solutions after β-GP addition but before gelation, D: pH of the chitosan and collagen solutions after gelation. E: chart of pH decreases after gelation. F: gelation time of chitosan and collagen hydrogels. In general, high β-GP concentrations decreased pH and increased gelation time. High chitosan/collagen ratios decreased both pH and gelation time. (n = 3 separate experiments for all parameters; & = statistically significant differences; * = statistically significant differences existing among the groups containing different β-GP concentrations; # = statistically significant decrease in pH after gelation)

