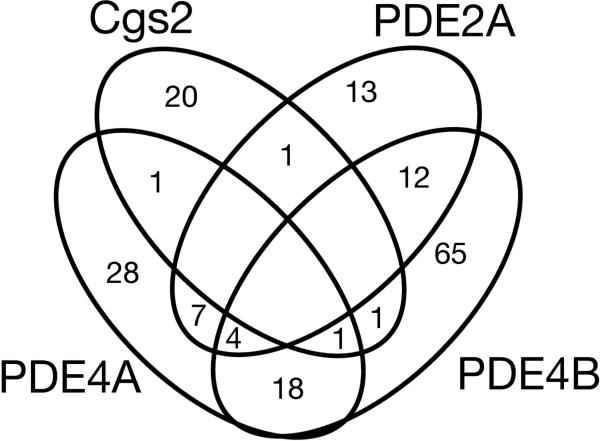
Figure 5.
Venn diagram of compounds identified as candidate PDE inhibitors. The overlap of compounds that confer 5FOAR growth, producing a composite Z score of ≥8.53, is shown for CHP932 (Cgs2), LWP369 (PDE2A), CHP1098 (PDE4A) and CHP1113 (PDE4B) against 3,120 compounds representing a subset of the Prestwick Bioactive and the Microsource Spectrum compound libraries.

