Figure 7.
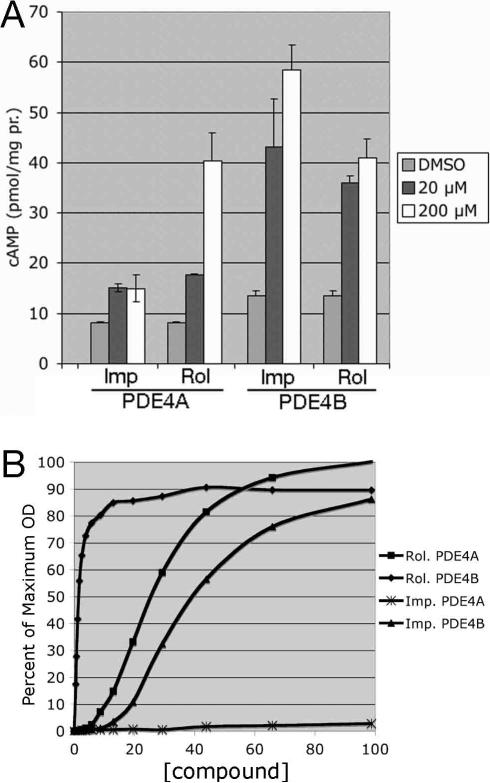
Verification of imperatorin as a PDE4 inhibitor. A) cAMP response to rolipram or imperatorin by CHP1085 (PDE4A) and CHP1114 (PDE4B) cells. cAMP levels were measured 60 minutes after addition of either vehicle (DMSO), 20 μM drug, or 200 μM drug as indicated. Values represent the average and SD of two independent experiments. B) Dose response curves for rolipram- and imperatorin-exposed CHP1098 (PDE4A) and CHP1113 (PDE4B) cells. Results from a typical experiment are given. Each datapoint represents the mean of 12 wells. Standard deviations were generally 3% to 4% of the means. OD600 values are presented as a percent of the cAMP-stimulated 5FOA-resistant growth.

