
Figure 2. Anti-melanoma activity of [pIC]PEI in mice.
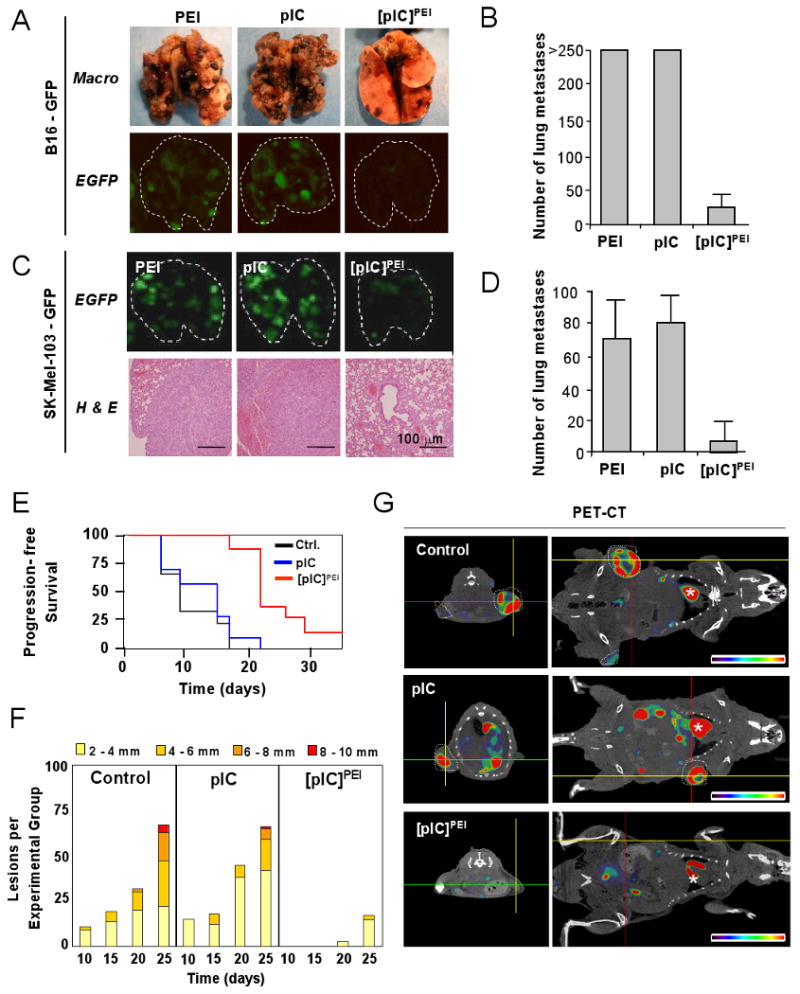
A-D are results from SCID Beige mice; E-G are results from Tyr::RasQ61K × Ink4a/Arf-/- mice.
(A) Representative images of lungs of mice 14 days after i.v. inoculation of B16 melanoma cells and treatment as indicated, and photographed under visible (Macro) or fluorescent (eGFP) light.
(B) Representation of the mean number of metastases (± SEM) induced by B16 as indicated in (A). P*<0.01 between PEI or pIC and [pIC]PEI treatment groups (n=5; generalized Mann–Whitney test).
(C) Lung colonization by eGFP-SK-Mel-103 in SCID-beige mice treated with the indicated agents and assessed by fluorescence imaging and histological analyses.
(D) Quantification of average number of external lung nodules (± SEM) in the indicated treatment groups shown in (C). P*<0.01 between PEI, pIC and [pIC]PEI treatment groups (n=5; generalized Mann–Whitney test).
(E) Cohorts of Tyr::RasQ61K × Ink4a/Arf-/- mice were treated topically with a single dose of 200 μg DMBA at 8 weeks of age. Upon appearance of pigmented lesions of >1 mm diameter, mice were treated as indicated. Control groups received PEI in 5% glucose. The fraction of animals with tumors of <1mm diameter (progression free survival) was represented by Kaplan-Meier graphs.
(F) Average number of cutaneous melanocytic neoplasms developing in each of the different treatment groups. Scoring was performed every five days and tumors were grouped by size as indicated.
(G) Representative transverse (left panels) and coronal sections (right panels) of PET /CT fused images to assess metabolic activity (18F-FDG incorporation) of representative examples of mice treated as indicated. Tumors are encircled with white dashed lines. The asterisks mark animal hearts.