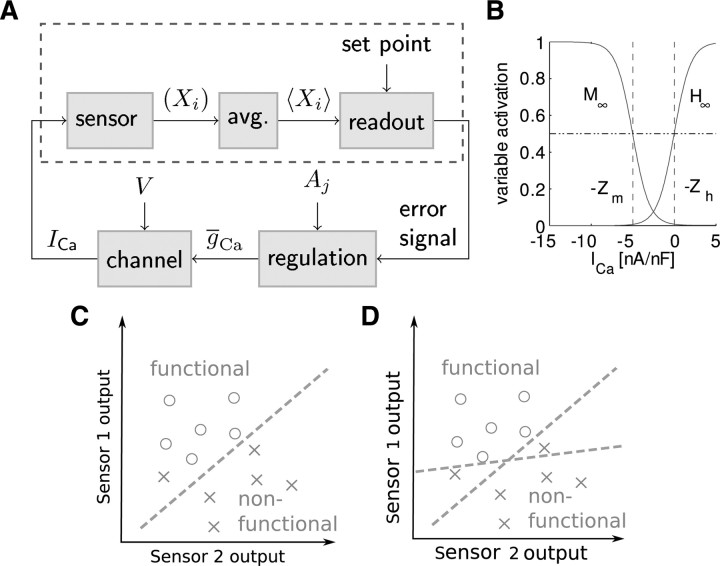
Figure 2.
The sensor and readout components within the context of ADHR. A, Engineering-style schematic illustrating the full feedback loop of ADHR. The scope of this paper is depicted with the dashed rectangle, in which ICa is used to generate an error signal. The error is calculated by the readout as the difference between the average of the sensors (average) over the network rhythm period, T, and a set point. Based on this error, a hypothetical regulatory mechanism can use a direction, Aj, to adjust each maximal conductance, such as ḡCa that modulates ICa based on voltage, V. B, The sensors are defined with the steady-state curves of their activation (M) and inactivation (H) variables (Eqs. 2–4). C, The readout can be a linear classifier that separates functional networks from nonfunctional networks by drawing a hyperplane in the average sensor parameter space of two example (fast and slow) sensors. D, When the input classes are linearly nonseparable, the readout must use multiple hyperplanes.

