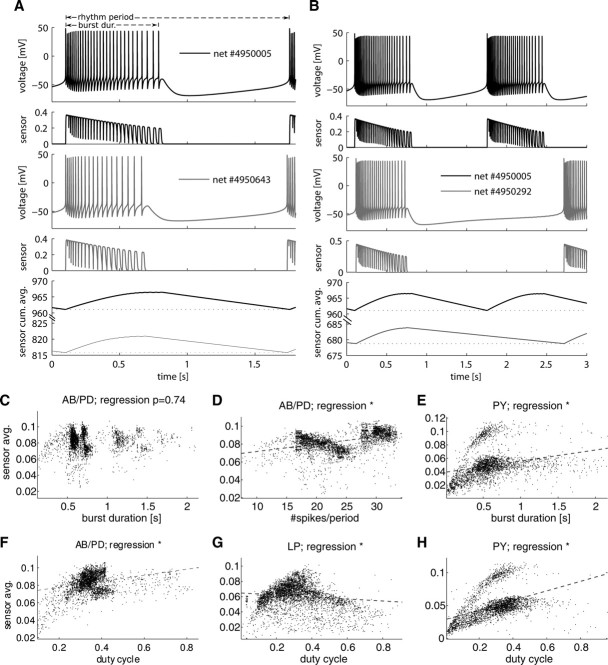
Figure 4.
Activity sensors represented both the bursting activity and the rhythm period of a cell, being a good indicator of the bursting duty cycle. The sensor used is the same as in Figure 3. A, Traces from AB/PD models in two example networks (solid and dashed lines) show that, when the cell rhythm period is invariant (∼1.6 s), an increase in the burst duration (from 0.6 to 0.8 s) increases the sensor cumulative average (sensor cum. avg.; bottom trace) and, therefore, the sensor period average (dotted line). Network model parameters are given in supplemental Table S1 (available at www.jneurosci.org as supplemental material). burst dur., Burst duration. B, Other example AB/PD models show that increasing the rhythm period (from 1.6 to 2.4 s) decreased the sensor period average for cells with similar burst durations (0.7–0.8 s). C, The AB/PD burst duration was not significantly correlated with its sensor average. D, The AB/PD sensor average and number of spikes were significantly correlated (*p < 10−4). To avoid saturation in the scatter plot, uniform noise between −0.5 and +0.5 was added to the number of spikes after regression. E, The PY sensor average was significantly correlated with its burst duration. F–H, All three model cell sensor averages showed significant correlations to their duty cycle characteristic. The correlation was no longer positive for LP in G for physiologically unrealistic duty cycles larger than 0.5.

