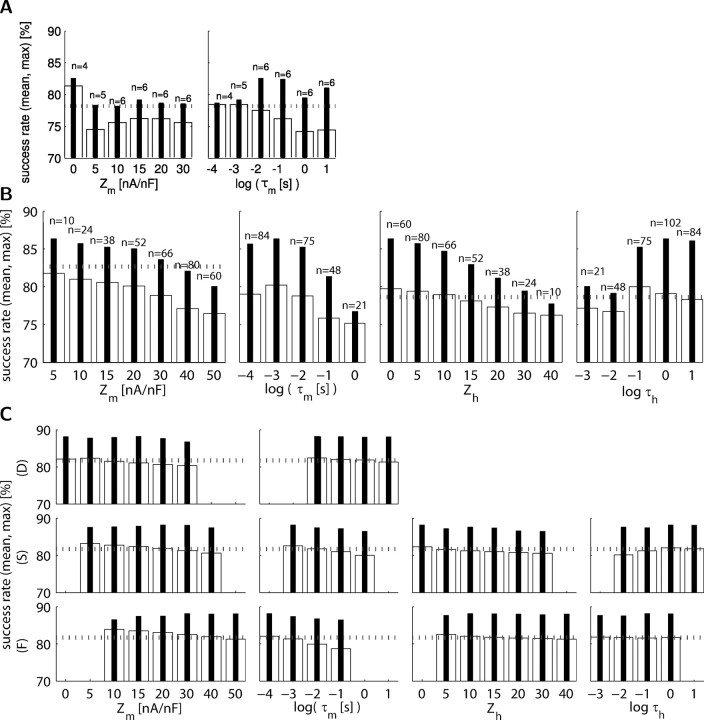
Figure 6.
Sensor time constant (τ) and calcium current sensitivity (Z) parameters are broadly tuned. In the bar plots, the inner bars show the maximal success, and open bars show the mean success. The dotted horizontal line shows the mean success from all sensors. A, Success with varying activation variable parameters of the non-inactivating sensors (n = 33; 3 sensors that always produced 0 output were omitted). The n values for each bar vary based on the sensor construction rules (see Materials and Methods). B, Same as A but for inactivating sensors (n = 330). C, Success for parameter values for each of the fast (F), slow (S), and DC (D) sensors.

