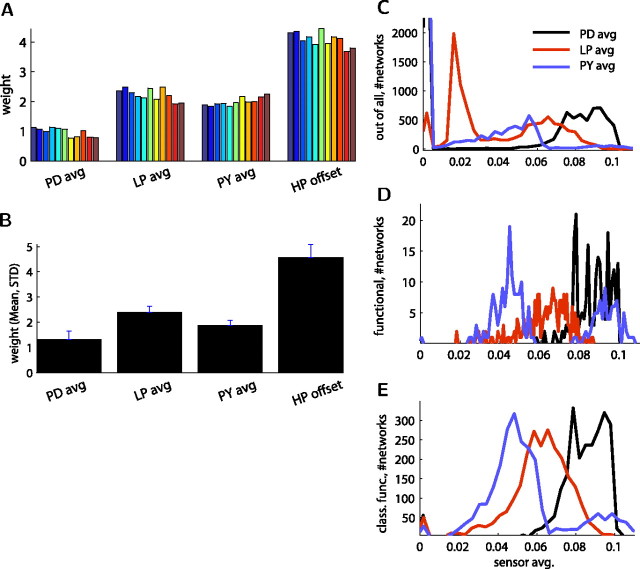
Figure 8.
Classifier weights of best performing sensors consistently selected specific proportions of the sensor of each cell for classifying functional network activity. A, Weights found by the top 11 best sensors were consistent (best sensor being the rightmost, brown color). B, Mean and SD of the sensors with success >80% (n = 63) maintained the same proportions between the weights of sensors of different cells and the offset value. The weight of each cell sensor was significantly different from each of the others (p < 10−4, same for separate one-way ANOVA for each pair and also one for all together). C–E, Distribution of the average optimal sensor readings from the three cells (each into 100 bins) for all networks classified (C; n = 9915, the truncated 0 bins showing no activity were 4208 for AB/PD, 663 for LP, and 5662 for PY), for functional networks (D; n = 221), and for classified functional networks (E; n = 2834).

