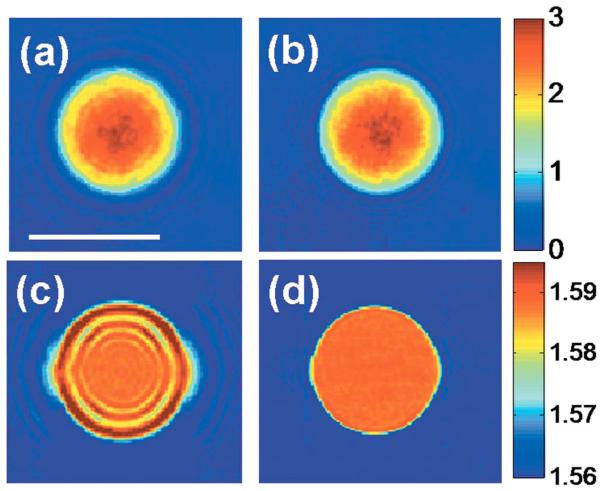
Fig. 2.
(Color online) Effect of sampling depth on refractive index tomograms. (a) Phase image of a 10 μm polystyrene bead with the focus 4 μm above the center of the bead. (b) Quantitative phase image after applying the propagation correction, with the focus brought to the center of the bead. The color bar indicates phase in radians. (c) x–y slice of the refractive index tomogram for the same focus as in (a). (d) x–y slice of the refractive index tomogram after applying the propagation algorithm. The color bar indicates the refractive index measured at λ=633 nm.

