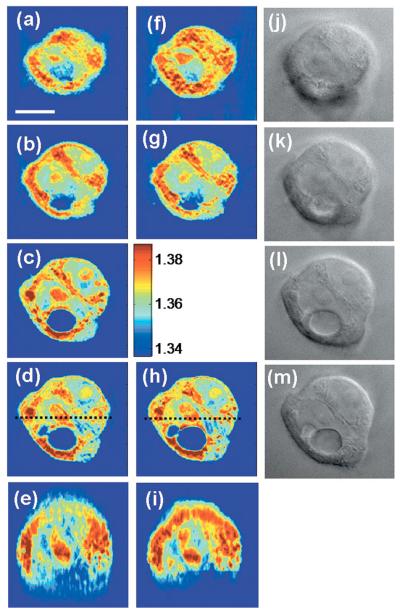
Fig. 3.
(Color online) Refractive index tomogram of an HT29 cell before and after applying the propagation correction. (a)–(d) Successive x–y slices of the refractive index tomogram at 2 μm intervals in the axial direction, before applying the propagation correction. (f)–(h) x–y slices corresponding to (a), (b), and (d) after applying the propagation algorithm. (e) and (i) x–z slices along the dashed lines indicated in (d) and (h), respectively. The color bar indicates refractive index at λ=633 nm. (j)–(m) Bright field images with the image focus corresponding to (a)–(d). Scale bar, 10 μm.

