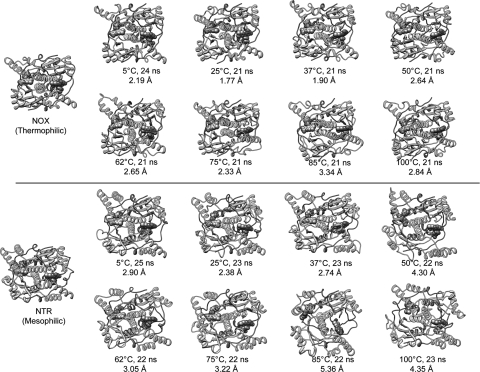
Fig. 2.
Crystal structures of NOX (thermophile, top) and NTR (mesophile, bottom) and snapshots from MD simulations of NOX and NTR. FMN cofactors are shown in sphere representation, colored by element. Each MD structure is from the indicated time point of a simulation at the indicated temperature. The Cα RMSD to the respective starting structure is also given. Black boxes indicate the optimal growth temperatures. Note that the structure of NTR becomes more distorted than that of NOX. See also Fig. 3. A color version of this figure is available as supplementary data at PEDS online.

