Fig. 5.
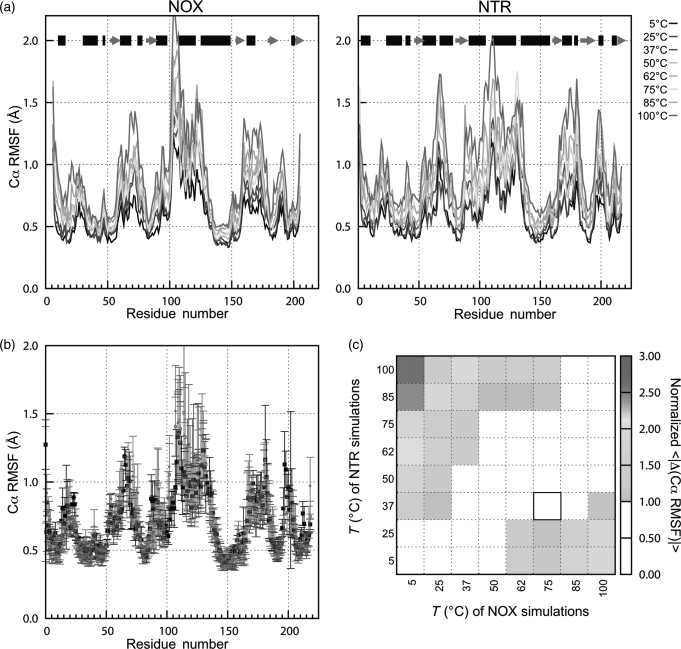
Global mobility of NOX (thermophilic) and NTR (mesophilic) measured by Cα RMSF. (a) Cα RMSF of NOX (left) and NTR (right). Data are the average values for the two monomers in two to three simulations, using only the last 2 ns from each simulation. Using data from 2 ns to the end of each simulation gave higher Cα RMSD values for both proteins, but similar qualitative results. Black bars at the top indicate α-helical regions of structure, gray arrows show β-sheets. (b) Comparison of Cα RMSF values for NTR at 37°C and NOX at 37 and 75°C. The optimal growth temperatures of NTR and NOX are 37 and 75°C, respectively. Data are the same as in (a). Error bars represent the standard deviation of values from three simulations. The sequences of the two proteins are aligned as described in Methods. (c) Average absolute differences (normalized by combined standard deviation) in Cα RMSF vs. as a function of the temperatures of the two sets of simulations. Note the strong diagonal feature, indicating that at similar temperatures, NOX and NTR have similar Cα RMSF. Black box shows the optimal growth temperatures for the two proteins' host organisms. A color version of this figure is available as supplementary data at PEDS online.

