
Figure 3.
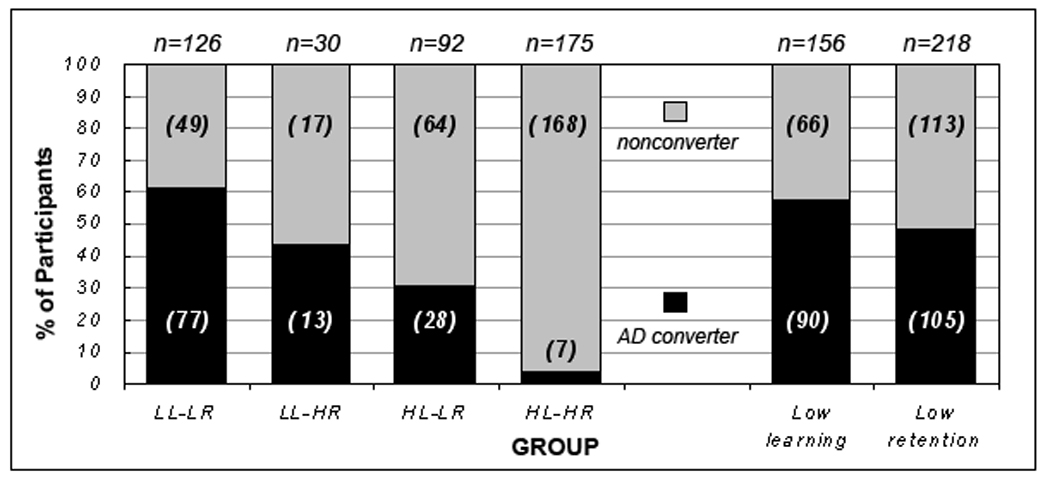
Bar chart of AD conversion rate over two years for the four groups (left) as well as for the combined low learning/ retention groups (right).
Official websites use .gov
A
.gov website belongs to an official
government organization in the United States.
Secure .gov websites use HTTPS
A lock (
) or https:// means you've safely
connected to the .gov website. Share sensitive
information only on official, secure websites.
Bar chart of AD conversion rate over two years for the four groups (left) as well as for the combined low learning/ retention groups (right).