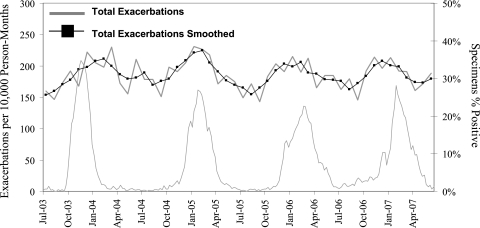
Figure 2.
CF pulmonary exacerbation incidence rates per 10,000 person-months and US influenzalike illness rates among patients with < 2 pulmonary exacerbations, July 2003 through June 2007. Y-axis changed from Figure 1 to demonstrate seasonal variation. Smoothed function is a moving average of five data points: the two previous, the current, and the two subsequent incidence rates. See Figure 1 legend for expansion of abbreviation.

