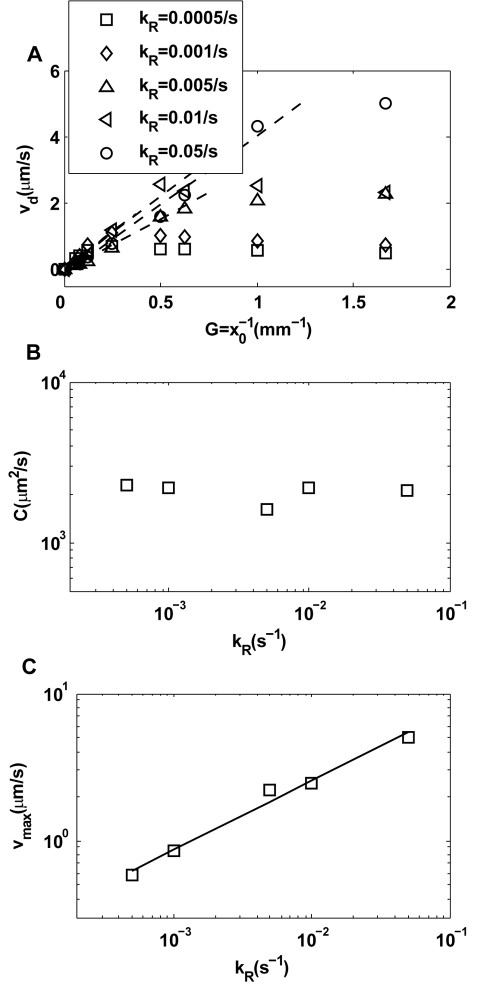
Figure 3. Dependence of chemotaxis motion on the adaptation rate.
(A) The chemotaxis drift velocity  for different exponential gradient
  . Different symbols represent different adaptation rates
  . Note that
  first increases linearly (dashed line) with
  before reaching a saturation velocity at a critical gradient
  ,. We can fit
  with:
with:  , in which
  is the chemotaxis motility constant given by the linear fitting coefficient and the saturation drift velocity is
  . The dependences of
  and
and  on
on  are shown in (B) and (C) respectively. For the range of
  we studied, we found that
  is roughly independent of
  and
and  depends on
  with a simple scaling relation:
  .
.

