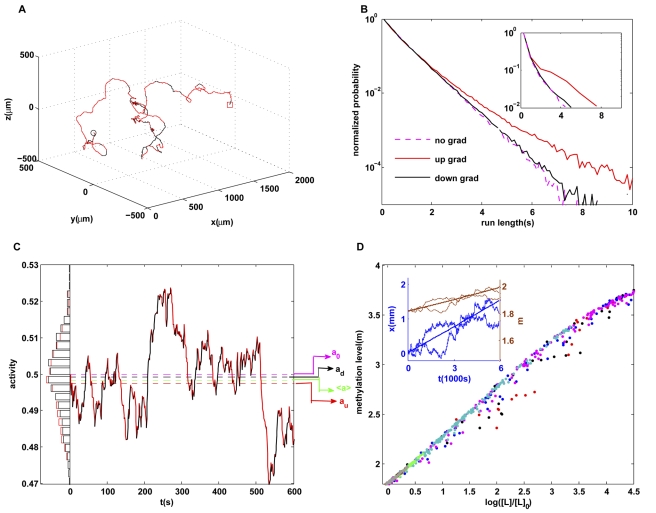
Figure 4. Single cell behaviors in exponential attractant gradients.
(A) Trajectory of a cell for 10 min for  with
with  . The random walk motion is biased towards the gradient (arrow). The forward runs up the gradient are in red, and the backward runs down the gradient are in black. (B) Run length distribution for forward runs (red), backward runs (black) in the presence of an exponential gradient and without a gradient (purple). The backward run length distribution is close to the run length distribution in the absence of a gradient, similar to the experimental results from Berg and Brown [37] as reproduced in the inset. (C) Distributions of cell kinase activity for forward (red) and backward (black) runs. A time series of the activity
  of a single cell is shown: forward is in red and backward is in black. The average activity for backward (black dashed line) is closer to the adapted activity (purple dashed line, 0.5) compared with the average activity for forward (red dashed line). (D) Methylation level of different individual cells at different times and in different exponential gradients (represented by color symbols as in Figure 2) all increase with logarithmic ligand concentration along a universal line, despite large temporal fluctuations in methylation levels and positions for (two) individual cells as shown in the inset.

