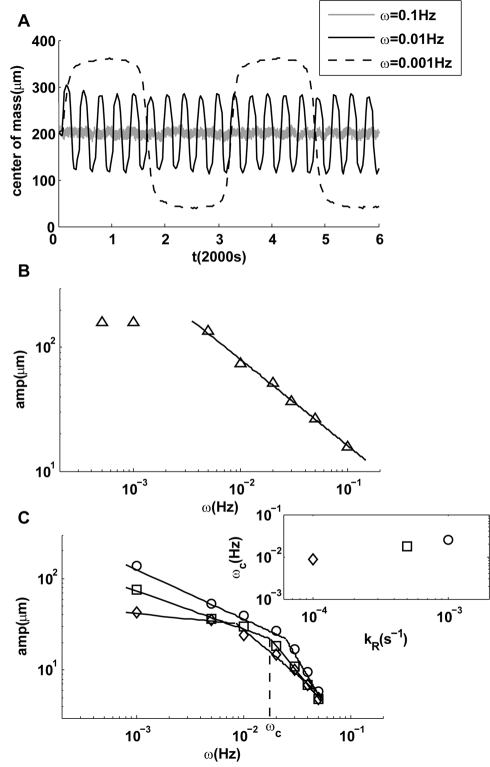
Figure 5. Responses to oscillating linear gradient.
(A) Time dependence of the average positions of cells for three oscillatory gradients, all with the same amplitude but different frequencies (ω). The responses have the same frequencies as their driving signals, but the response amplitude decreases with the driving frequency. (B) The amplitude of the response decreases with frequency ω. The cross-over at low frequency ( ) is caused by boundary effects. (C) Upon decreasing adaptation rate, a transition to a steeper decay of the amplitude appears at frequencies higher than a transition frequency
  within the range of frequencies studied. Three cases with smaller values of
  are shown, and the dependence of
  on the adaptation rate
  is shown in the inset of (C).

