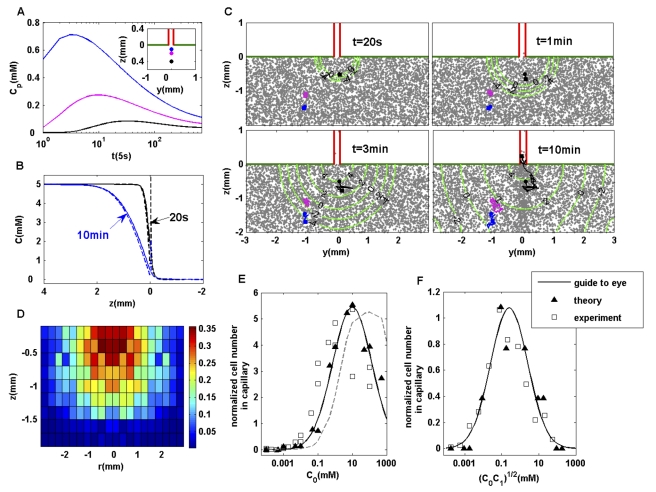
Figure 6. Quantitative simulation of the classical capillary assay and comparison with experiments.
(A) Time-dependent ligand concentrations at three different positions in the suspension pool (see inset) from directly solving the ligand diffusion equation. The ligand concentration at a given position peaks at a given time, depending on its location.  . (B) The exact ligand profile (solid line) along the center line of the capillary at different times, in comparison with the asymptotic solutions (dashed lines) by Furtelle and Berg [42]. (C) Cell density in the rectangular coordinate is shown together with the contours of the logarithmic ligand concentration (in
  ) at different times. Three individual cell trajectories (starting from circles and ending at squares) are shown. Only the black cell ends in the capillary. (D) Probability distribution of the original positions of cells that end in the capillary. For a cell originally located at position
  , the probability of it ending in the capillary at a later time (45 min),
  , is shown.
  ,
,  . (E) Concentration-response curve for the capillary assay. The average number of bacteria in the capillary after 45–50 min subtracted by the number of bacteria in the capillary in the absence of attractant is defined as the response (ordinate). The results from our model with the exact ligand profile are labeled by solid symbols (fitted by a solid line). They agree well with the experimental measurements (hollow squares) of Mesibov et al [22],[23]. The results from using the asymptotic ligand profile by Furtelle and Berg are shown by the dashed lines. (F) Response curve for capillary assay with
  . The solid symbols (fitted with a solid line) represent the model, and the hollow symbols represent the experimental results [22] (both collected at 60 min).

