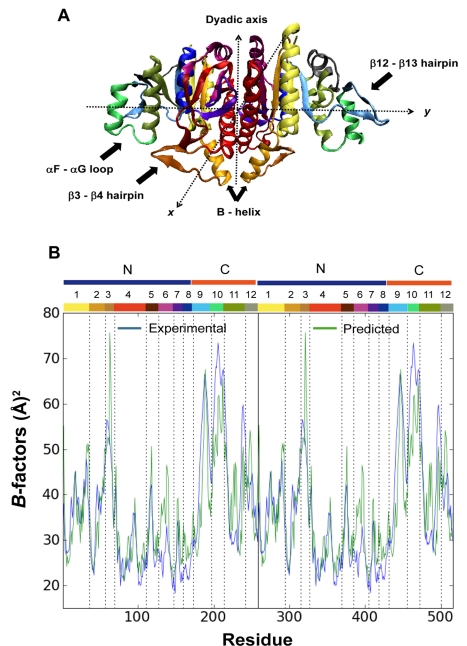
Figure 2. Structure and fluctuation dynamics of the open conformation of NAGK.
(A) Color-coded ribbon diagram of NAGK where regions involved in substrate binding are indicated by arrows. All secondary structure elements are highlighted with different colors. (B) Comparison of experimentally observed (blue) and computationally predicted (green) B-factors. The theoretically predicted B-factors are rescaled based on the experimentally observed B-factors averaged over all residues. Experimental data refer to the PDB structure 2WXB (to be published). The range of residues of N and C domains is highlighted. The different parts of the protein have been numbered as follows: (1) β1+αA; (2) β2+αB; (3) β3–β4, the NAG lid; (4) αC+β5; (5) β6–β7; (6) αD+β8; (7) β9–β10;(8) αE; (9) β11+β12–β13+β14; (10) αF+αF–αG; (11) αG+β15; (12) αH+β16. The color code of the numbered parts of the protein is the same in both subunits, and indicated along the upper abscissa.

