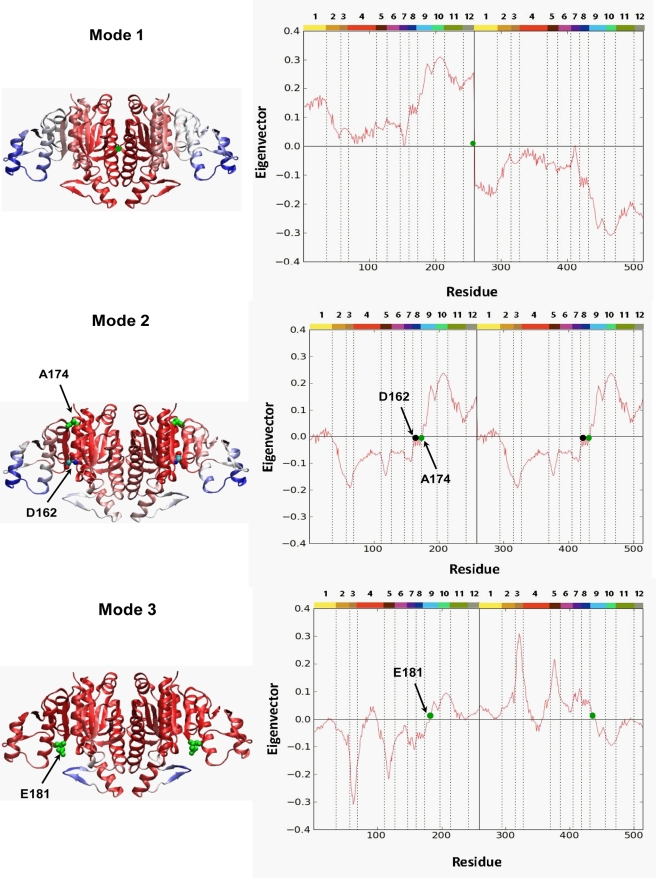
Figure 3. Mobilities of residues.
Results are presented for the softest three GNM modes. On the left, the ribbon diagrams of NAGK, color-coded according to the mobilities of residues in the respective modes are displayed. The most mobile residues are colored blue, and the most rigid ones, red. The green dots on the diagrams indicate the position of the hinge sites. Note that in mode 2 the hinge sites closely neighbour the residue D162, which is a key catalytic residue.

