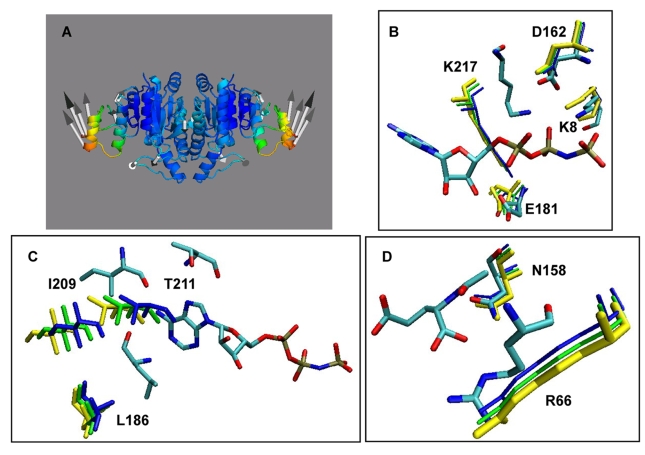
Figure 5. Movement along the slowest ANM mode.
Motion of active site residues between open and closed conformers along the 1st ANM mode accessible to the open form. The position of these residues in different conformations is shown: open conformation (yellow), intermediate positions (green and blue) and closed conformation (atom-colored). (A) Color-coded ribbon diagram for motions along the 1st mode (generated with the ANM web server [25] and Pymol [64]). (B) Movement of catalytic residues with respect to the ATP analogue. (C) Movement of ATP binding residues with respect to the nucleotide. (D) Movement of NAG binding residues with respect to NAG.

