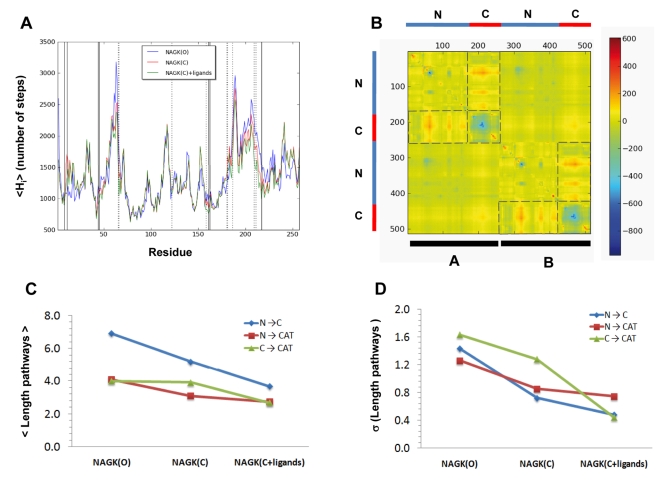
Figure 6. Communication properties of NAGK.
(A) Mean hitting time profile for the open and closed (with and without ligands) forms of NAGK. Vertical lines indicate the positions of catalytic (solid line) and ligand-binding residues (dotted line). Note that catalytic residue tend to occupy minima positions, indicative of their efficient communication properties. (B) Difference map between the contribution to hitting times from cross-correlations ( ) (equation (8) in
Methods
) of the open and ligand-bound closed forms. Dashed lines set the boundaries of N- and C- domains and also enclose those pairs of domains that undergo the largest changes in the contribution from cross-correlations upon ligand binding. (C) Mean path lengths for linking different parts of the protein: N- and C-domains (blue), N-domain and catalytic site (red), and C-domain and catalytic site (green). (D) Standard deviation in the mean paths displayed in panel (C).

