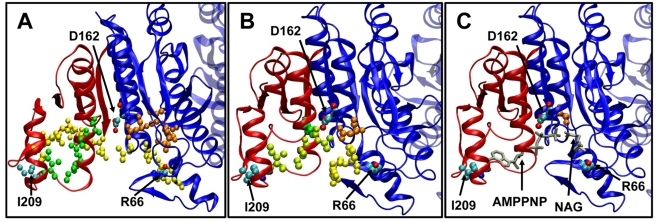
Figure 7. Communication pathways between catalytic site and ligand-binding residues in EcNAGK.
The communication pathways are represented by the network of residues (each atom is shown as a dot) along the shortest paths of communication between the following residue pairs: R66-L209 (yellow), R66-D162 (orange) and L209-D162 (green). These three cases are representative of the communication between a NAG-binding residue (R66) on the N-domain, a catalytic site residue (D162) and an AMPPNP binding residue on the C-domain (L209). These residues at the endpoints of the pathways are colored by atom name. N- and C- domains are colored blue and red, respectively. These pathways are shown for the three states considered: (A) Open state. (B) Closed state. The pathways R66-L209 and L209-D162 have three residues in common (colored in light green). (C) Closed state with ligands AMPPNP and NAG. The ligands are shown with gray sticks for a better visualization and participate in all three pathways considered in the figure. Note that the ligands directly establish the communication between the pairs of residues considered.

