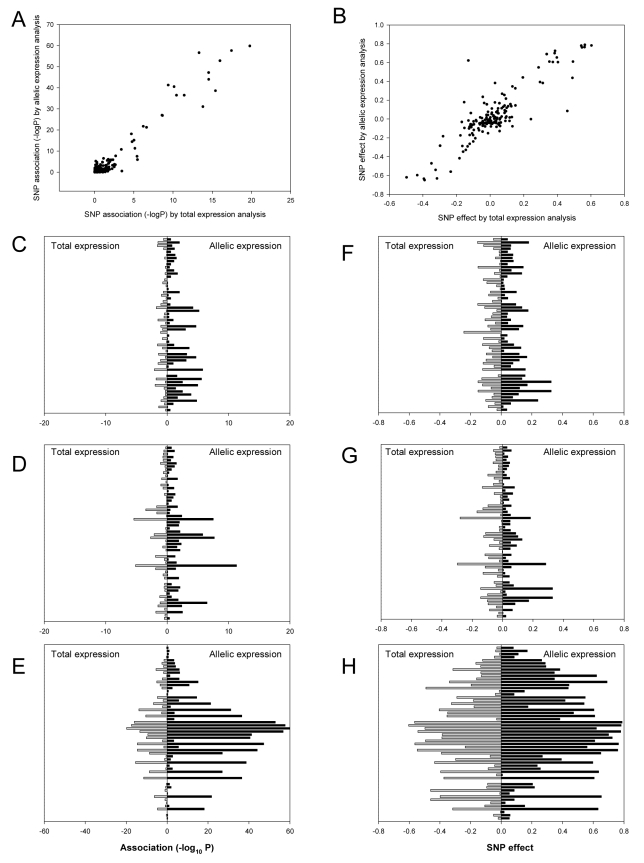
Figure 2. Significance of associations and effect size estimates using total and allelic expression.
Scatter plots depict the P-values (A) and estimates of effect size (B) obtained for each SNP for all three genes by eQTL (X-axis) and aeQTL (Y-axis) mapping. Bar charts show the comparison of the significance of association for CDKN2A (C), CDKN2B (D), and ANRIL (E); and the effect size estimates for CDKN2A (F), CDKN2B (G), and ANRIL (H). The Y-axes on the bar charts show the 56 SNPs ordered by chromosome location (most telomeric at the top). Grey bars to the left represent total expression and black bars to the right represent allelic expression.

